Navigation
Twitter and News feeds
Search this site
Networked Blogs

Entries in Brazil (20)

Monday
Feb142011

The wedding of the waters

Our colleagues at the Florida Aquarium have a group visiting the Amazon at the moment.  Check out this video of Allan Marshall explaining  - in melodramatic fashion - how the waters of the Rio Negro and the Rio Solimoes meet and don’t mix.

Thursday
Jan272011

Attenborough and deep sea corals

There’s a new website up that talks about deep sea corals, including one of the species the science team has been studying here in Brazil - Lophelia.  Its even called Lophelia.org and was put together by some Scottish scientists who discovered Lophelia reefs off the coast of Scotland in 2003.  It’s very comprehensive and well worth a visit, and it’s recently earned an endorsement of the doyen of nature documentaries, Sir David Attenborough.  One of the weird things to think about when you click on over is that the same corals that form those reefs in Scotland are forming deep reefs here in Brazil.  How is that possible?  I mean, one is in the chilly North Atlantic, while the other is in the tripical south Atlantic.  Well, if you think about it, once you go deep, it doesn’t matter where you are, it’s always gloomy dark and cold!  For example, even though the surface temperature was in the high 20’s (low 80’s for the US readers) here in Brazil, the temperature down where the sub was going was 7-9 dgrees (around 45).

A Dendrophyllia alternata (originally mislabeled here as Lophelia) colony collected from the Abrolhos platform

The new website is a great resource for learning more about Lophelia and other deep coral reef species and just maybe it will help us all broaden our horizons to start considering coral reefs in a context broader than the insanely colourful shallow reefs that most easily comes to mind when you hear the phrase.

Wednesday
Jan262011

Who's nourishing the deep reef?

As we were steaming along yesterday, we encountered a mysterious yellowish slick along the surface.  Sometimes it formed into filaments stretched out like cobwebs on the surface, but in other areas it was thick enough to make the water surface totally opaque.   What could it be, so far off the coast?  fish spawn? coral spawn? algae? oil, maybe? So we slowed the ship and took a bucket sample from over the side (thanks Maurice!).  The culprit? Trichodesmium.  This blue-green alga is common in the nutrient poor waters of the tropics, and occasionally forms huge blooms like this.  How can it bloom when nutrients are so scarce?  The answer is that it makes its own nutrients; Trichodesmium is a “nitrogen fixer”.  This means it can take nitrogen from the air and incorporate it into its own molecules and tissues, a relatively rare feat (the best known example on land are legumes like peas and beans).

If Trichodesmium blooms like this, then the impact can ripple through the ecosystem because, once fixed, the nitrogen is available to the rest of the food chain.  This can make Trichodesmium a key species.

All of that brings us to Dr. Paulo Sumida from the University of Sao Paulo.  Paulo is on this expedition to study organic matter, like the products of all that Trichodesmium.  He’s especially interested in what’s happening on and just above the bottom, where the sub is visiting.  One of the biggest questions: is the organic matter in the sediment of the dark deep made by organisms on the bottom elsewhere and transported there, or is it made by plankton in the water column above (like Trichodesmium), and then rains down like nutrient snow?  One of their other hypotheses is that the southern part of Abrolhos is more productive than the north.  In other words, that more organic matter is produced there by greater numbers of organisms.  To work out the answer to these questions, Paulo looks for clues about how much organic matter there is, what “quality” it is and who made it. 

Dr. Paulo Sumida peers out of a porthole on the JSL sub

Measuring how much organic matter there is is relatively straightforward with an instrument called a CHN analyser (C = carbon, H = hydrogen, N = nitrogen, the key ingredients of organic matter).  To measure quality, Paulo looks at how much of the photosynthetic pigment chlorophyll is present.  If the organic matter is old, most of the chlorophyll will have broken down in a process scientists call diagenesis, leaving behind waste products called phaeopigments.  The relative amounts of chlorophyll and phaeopigments can be used as a measure of the quality of organic matter.  Perhaps the coolest part, however, is trying to work out who made the stuff.  To do that, Paulo uses a rare tool at the University of Sao Paulo, called a GC-IR-MS (gas chromatograph isotope ratio mass spectrometer, say that ten times fast).  This instrument can look for chemical signatures that tell you who made the organic matter.  For example, phytoplankton might produce organic matter with certain carbon isotopes in it, while benthic algae might produce a certain sterol compounds that, when Paulo sees them, he can say “Aha! Now I know that this organic matter was made by this group or that group”. It’s a great bit of detective work.

Taken together, all this information tells Paulo and the other scientists about how nutrients move from water to sediment and back again (properly called “flux”) and therefore how tightly life on the bottom is connected (“coupled”) to life in the water column.  It also speaks to how connected different parts of the bottom may be, especially if organic matter proves to be made somewhere else and then transported to the dark zones.    So what’s the answer? Is it produced on the bottom or in the water column?  By algae or by phytoplankton?  Unfortunately, we don’t know yet, because this is just the sample collection phase; his research is just beginning.  I hope in a future post I can tell you about the results of Paulo’s work.

Wednesday
Jan262011

The Briny Deep - a post by Kristie Cobb Hacke

Yesterday morning on a tour of the bridge of the Steward Johnson following the deployment of the submersible, we had the opportunity to chat with some of the sub crew and a pilot. During our chat they were sharing stories of other dives. One in particular was incredibly interesting to me because it continues the idea of worlds within worlds (the sneeze theory). Craig Caddigan was mentioning that he piloted the submersible to a location in the Gulf of Mexico that contained an “underwater lake.” The lake was a dense brine pool, made up of water with an incredibly high density due to salinity and found at over 2000 feet depth. Craig described landing the sub on the lack and bouncing along the surface and creating ripples. The brine area has its own waves and “beach”, in this case surrounded by a 10’ ring of mussels. The mussels use methane as their primary food source. The submersible was unable to descend into the brine lake because it was too dense, but they did take along some tools that could sample the contents.

A brine pool in the Gulf of Mexico

What is amazing to me is that this brine sea is contained within the ocean. Do the animals that live around this area know that they are living in a sea within a larger ocean? When I sit on the beach am I merely sitting on the edge of a pool within someone else’s greater ocean. Am I at risk of being someone else’s sample? These big thinking questions are what keep me going but the scientists aboard the Abrolhos are focused on the small things that make up the ocean. Right now they are collecting small coral samples, sediment, rock, fish and other items. During the cruise other members of the HBOI staff have been creating maps so that the scientists can use them for future trips or they can clearly note the location of sample and sediment collections. The CTD collected water at the same locations where the submersible was deployed, so that bacteria and viruses can be measured and identified in the water column. The hope is that each of these small pieces can create a larger overall understanding of the structure and biology of the Abrolhos reef.

Wednesday
Jan262011

The moonpool

Generally-speaking, holes in ships are A Bad Thing, but in the center of the R/V Seward Johnson there is a hole, a really big hole, that’s both deliberate and critically important.  It’s called a moonpool and it’s used to deploy the device that allows the Com-Track (see previous post) to talk to the sub: the transducer.  This acoustic tool (basically a combination speaker and microphone) could just be dangled over the side, but the hull of the ship would interfere with the signal, so they lower it through the moonpool well below the ship.  It’s a lot like putting up an antenna, only upside down.  As I stared down into the blue glow, Sully the Com-Track officer was using the transducer to speak to the sub pilot, 800ft further down into the depths below…


PS - If you’re wondering why the water doesn’t rush up through the moonpool it’s because the water in the moonpool is level with the surrounding sea level, so there’s no pressure to push it up into the hull.

Wednesday
Jan262011

Poseidon smiles

The swells died away this morning and the science crew was thrilled to make it back in the water.  As I type, lead scientist Rodrigo Moura is in the sphere and geologist Alex Bastos is in the back and they’re 800ft down on the south edge of the Abrolhos Platform.  They’re exploring a steep sandy slope (like, 45 degrees steep) expecting sponges and fishes and collecting sediment samples for the geological context and to measure the quantity and origins of the organic matter, which is important to understand how much the ecosystem there relies on plankton above or on its own productivity at the bottom.


In the photo above, Jim “Sully” Sullivan sits at the Com-Track for the submersible, while Brazilian scientist Paulo Sumida (U. Sao Paulo) takes notes.  Com-Track is a station on the bridge of the ship, where sub crew staff and scientists can track the position of the sub and communicate with the scientists onboard.  Its not that straightforward, though, because there’s no cable to the JSL and radio and other EMF frequencies don’t travel through water.  Instead, communication takes place embedded in acoustic signals, with limited voice coms and a system of “pings” to serve as acknowledgement/agreement.  The whole shebang is tied into the GPS system for the ship, which is what made it possible for Bill Baxley to embed the sub track in his lovely 3D model.  If all goes according to plan, I’ll send an update on what they find later today


Tuesday
Jan252011

A *bit* of a tour of the Johnson Sea Link

Kristie Cobb Hacke and I were given a royal tour of the JSL submersible today, by longtime pilot Don Liberatore.  Unfortunately the ships satellite internet won’t handle the 20+ minutes of 1080p goodness, so these two snippets will have to do.  I’ll splice together the full vid when we get back to a wired internet connection. In the first video, Don describes the sample bucket system and in the second, I poke my head into the rear observation chamber

Tuesday
Jan252011

Taking mapping to a whole new level

When you set out to drive somewhere, or to sail a boat, you put a lot of faith in maps.  You trust that things are where the maps says they are and that there’s nothing where the map says there’s nothing.  Can you imagine the chaos if the map didn’t sync up with reality?  It’s relaitvely easy to make faithful maps for roads because, for the most part, they’re man made, and someone planned and engineered them, so they have good survey data.  But for oceanic charts, its a bit different.  Charts are made by sounding (measuring the depth to the bottom at a specific point) and then joining up all the points of the same depths into contour lines (isobaths).  But because you can’t usually see the bottom over which you sail, you really have to trust that whomever made the chart did a decent job of it.

In this overlain image of two charts, you can see how one (the black lines) does not match the other (coloured lines)

Bill Baxley noticed that some of the charts for the area of the Abrolhos shelf where we are working don’t even match up with each other very well.  That means someone is right and someone is wrong, so Bill - the Harbor Branch director of technical operations for this expedition - is using downtime in between sub dives to better map the bottom.  At night, while the science crew grabs some much-needed shut-eye, Bill and the ship’s crew sail back and forth across the shelf break, taking super accurate readings of the depth using sonar equipment and precisely geolocating the soundings by GPS.  From all these data, he has not only created a much more reliable map for use on future research trips to this area, he’s even able to use GIS software to render the bottom in three dimensions.  In the movie below, Bill animated his map so that you can quite literally see the north shelf break of the Abrolhos platform rotating before your eyes.  He’s even put two submersible tracks on there.  The deeper of the two in red is the one where the bottle was seen, and on which this photo and video post was based.  If this isn’t just about the coolest thing ever, I don’t know what is!

Tuesday
Jan252011

Good old-fashioned home-grown oceanography!

If oceanography had a classic bread-and-butter technique, CTD casts would have to be it.  The C stands for conductivity (basically salinity), the T for temperature and the D for depth.  The “cast” refers to the fact that you measure these three properties as the instruments descend to - and return from - the sea floor.  CTD casts tell scientists about the structure of the water column beneath them.  How can water have structure?  Well, differences in temperature and salinity can lead to layers in the water and these can tell you about how the water is or isnt moving and also have implications for animal life living there.  If you’ve ever swum in a lake where your body was warm but your legs were cold, then you’ve experienced a structured water column, or water layers.  (Strong structure like that often happens in summer when surface waters are warmed by the sun, which makes them less dense, so that they are even more buoyant.  When winter comes, the surface layer cools until it is denser than the underlying water, at which point the surface water sinks and the water column “turns over”)

In a world of side-scan sonar, ADCP and satellite sensing, CTD casts still play a really important role in understanding the water column, so they are still a core part of any oceanographer’s toolkit.  Let’s take a look at one.  This CTD/rosette sampler is part of an instrument package belonging to the Rosenstiel School of Marine Science at the University of Miami:


This rather expensive bit of kit stands about 6 feet high and consist of 24 sample bottles arranged in a ring, with the actual CTD instrument package underneath.  Together, this equipment can make accurate measurements of not only salinity, temperature and depth, but also dissolved oxygen and chlorophyll concentration, AND it can take a 10L sample at any depth using the “rosette” of bottles.  In the following video, U. Miami oceanographers deploy the CTD, then I discuss the acquisition of data with Cepemar oceanographer Carlos Fonseca, and finally graduate student Nelson Alves collects water samples from the sample bottles for a study on bacteria and virus diversity


So far here in Brazil we’ve seen a typical “surface mixed layer”, where the temperature and salinity is the same throughout the top 10-20m.  Below that, temperature drops sharply 4-5 degrees C to a colder underlying layer; this transition is called a thermocline (thermo = temperature, cline = a gradient) and is a standard feature of that well-layered water column.  Below that, temperature drops more gradually, but with some jagged steps that result from “salt fingers”.  These are small-scale turbulence features that tell oceanographers (like Carlos in the video) about mixing processes taking place in the water column.

The CTD - long time friend of oceanographers the world over!

Sunday
Jan232011

Dia 2 Campanha Seward Johnson - A guest post from Gustavo Duarte

Gustavo Duarte is a PhD student with the Abrolhos expedition.  Here, he describes for Portuguese readers, Day 2 of the research cruise.  Gustavo has a blog at IPAq; you can read more there.

_________________________________________

Ontem o que fizemos basicamente foi combinar toda a estratégia de coleta para hoje. O submersível estava agendado para descer as 8:00 da manhã com dois pesquisadores: Clovis Castro, meu orientador do Museu Nacional e Shirley Pomponi, do Harbor Branch, além do piloto e do co-piloto.

O mergulho foi um sucesso total. Foram trazidas várias espécies de mar profundo. O destaque foi uma belíssima estrala do mar, vários caranguejos bem diferentes, um lirio do mar e várias espécies de corais vivos.

A temperatura da água durante o mergulho foi de 6˚C aos 700 m subindo para 8˚C aos 450 m. Na verdade o submersível desce até a profundidade máxima do mergulho e vai junto ao fundo até a profundidade mínima e então sobe a superfície.

Os corais estão nos aquários que estão por sua vez dentro de uma câmara fria, a tal “environmental chamber”. Lá eu tenho água do mar corrente saindo de uma torneira. Montei os fragmentos num suporte usando superbonder gel e depois durepoxi. Se sobreviverem até amanhã vou alimentá-los com naupilios de artêmia e plancton coletado pelo navio.

Deu muito trabalho triar todo o material, veio muita coisa diferente. Mais a noite eu tento postar as fotos. Agora estamos fazendo coleta de água em várias profundidades para medir nutrientes, penetração da luz, níveis de clorofila, temperatura, tudo isso de acordo com a profundidade. Um pesquisador a bordo vai filtrar esta água e congelar o material a -80˚C para análise genética dos microorganismos presentes na coluna d’água. Para isso estão usando um CTD com uma rossette.

As 4 da tarde faremos um mergulho mais raso, que começará em 120 m e terminará em 70 m. Coletaremos amostras de corais com zooxantelas e eu medirei a resposta fotossintética destes organismos. Depois, usando uma serra copo, vou retirar uns plugs de cada coral e no laboratório do Rio iremos medir a clorofila das amostras, a microbiota associada bem como uma contagem de zooxantelas.

Com isso esperamos conhecer um pouco mais destes corais que conseguem fazer fotossíntese em regiões tão fundas.

Sunday
Jan232011

Foot in the Jackfruit - a guest post from Kristie Cobb-Hacke

Where in the world are you when the expression “foot in the jackfruit” makes sense?  Brazil. Recognizing that this euphemism “Pé na Jaca” loses some of its finesse in English, it is nevertheless something that makes travel beautiful.

My goal during this adventure is to avoid “ na jaca.” Yesterday in our travels from Vitorio to Nova Viçosa throughout the drive we were able to see coffee plantations, sugar cane and eucalyptus farms. All of these farms were on formerly-forested areas, so interspersed we were able to spot the pink mangos, purple mangos and many other varieties of native plants. Although the jack fruit thrives in this environment, it is an invasive species. It is originally from India and archeologists have revealed it was first cultivated there 3,000 years ago. This tree has the largest tree-borne fruit and has spread quickly throughout areas of Brazil as birds and animals eat the seeds of fallen fruit and deposit them elsewhere. In recent years there have been some forestry management efforts to rid the national parks of saplings as these fruit are thought to have contributed to the decline of certain bird species. 

 During our drive we discussed the cultural challenges that come with conservation efforts. The mere idea of discussing the lack of conservation in an area may be a time where I could certainly have been through of as insensitive. I certainly don’t want to be considered as an invasive species to the crew and scientists on the Abrolhos expedition.  We discussed the change in the landscape and the growth in the farming industry, particularly eucalyptus.

This area of the world is considered a biodiversity hot spot by conservation international. This is an overview:

The Atlantic Forest or Mata Atlântica stretches along Brazil’s Atlantic coast, from the northern state of Rio Grande do Norte south to Rio Grande do Sul. It extends inland to eastern Paraguay and the province of Misiones in northeastern Argentina, and narrowly along the coast into Uruguay. Also included in this hotspot is the offshore archipelago of Fernando de Noronha and several other islands off the Brazilian coast.

Long isolated from other major rainforest blocks in South America, the Atlantic Forest has an extremely diverse and unique mix of vegetation and forest types. The two main ecoregions in the hotspot are the coastal Atlantic forest, the narrow strip of about 50-100 kilometers along the coast which covers about 20 percent of the region. The second main ecoregion, the interior Atlantic Forest, stretches across the foothills of the Serra do Mar into southern Brazil, Paraguay and Argentina. These forests extend as far as 500-600 kilometers inland and range as high as 2,000 meters above sea level. Altitude determines at least three vegetation types in the Atlantic Forest: the lowland forest of the coastal plain, montane forests, and the high-altitude grassland or campo rupestre. (www.biodiversityhotspot.org).

The Atlantic Forest of Brazil

But in a place like Brazil that is growing and actively developing their resources, it is important to understand the ranking of conservation among the needs and challenges of a country that is home to approximately 3% of the world’s population: over 190 million people (http://en.wikipedia.org/wiki/Brazil) the vast majority living in urban cities. In many cases large numbers of citizens face much less complicated but much more personally critical decisions like food, clothing, water, waste management and health come long before thoughts of the care of the surrounding environment.

So for our bright and inspired scientists on this expedition it is going to be critical for them to be clear with their efforts and decisive with their results so that they can avoid sticking their ‘foot in the jack fruit” and they can begin the process of educating their fellow Brazilians and affecting change to preserve their native and incredibly diverse environment. On its own nature can maintain a diverse and complex system of life including production, consumption and disposal of waste. These processes are all seamless in a well-balanced system. If at any point a part of the system is disrupted the natural web may become imbalanced and threaten the health and loss of species at a minimum and, at a maximum, could be catastrophic.

Unfortunately, sometimes it takes catastrophe to serve as a wake-up call. One of our travel companions, Nina Bilton, is from the state of Rio de Janeiro and she shared that the recent torrential rains and the subsequent mud-slides have drawn tremendous attention to the environment and have activated the concern of a nation. So in all of this devastation one bright light is that dedicated committed scientists, organizations and corporations can occasionally come together to start the process of understanding the environment. At the core awareness is the science behind understanding the natural environment around us all.

As I write I am witnessing, for the first time, a completion of a submersible dive. I am excited to hear about what our researchers are seeing and learning and I’m looking forward to seeing the results. The data they have collected today is just one small piece to understand and protect the integrated web of life in the Abrolhos area.

(Kristie Cobb-Hacke is a vice president at Georgia Aquarium)

Sunday
Jan232011

Diving is like a box of chocolates...

…You never know what you’re going to get.  In this video, the Johnson Sea Link (JSL) is recovered after the first dive of the Abrolhos2011 Expedition.  Brazilian scientist Clovis Castro was aboard with HBOI scientist Shirley Pomponi. 

Afterwards, the science team went to work processing invertebrate samples including gorgonians, the hard coral Lophelia, and a range of brittle stars, crinoids, urchins and miscellansous crustaceans

The Brazilian science team evaluates their first samples. L-R Gustavo Duarte, Clovis Castro, lead scientist Rodrigo Moura and Ronaldo Francini-Filho


Reporter Glenda Koslowski with Brazilian scientists (L-R) Gustavo Duarte, Clovis Castro, Rodrigo Moura and Ronaldo Francini-Filho


PhD student Gustavo Duarte takes Lophelia fragments for cultivation

 Alex Bastos with a fine carbonate mud sediment core from 600m


Sunday
Jan232011

Day 1 cruise track

Here’s our Day 1 cruise track, taking us from Nova Viçosa out to a way point and thence to the R/V Seward Johnson.  Right click the link and save, then  open in Google maps or Google earth

Sunday
Jan232011

Rocking the Abrolhos

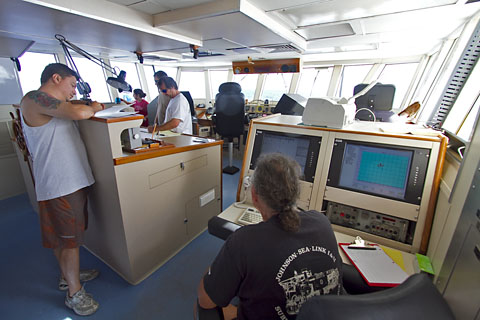
This is the first post from onboard the R/V Seward Johnson, currently at 18 deg 6 min S, 38 deg 25 min W, somewhere off the coast of Bahia State, Brazil.

_______________________

Alex Bastos likes rocks.  Biologists may scoff, but the truth is that rocks and geology provide the context for biology in the oceans, much the same way as a playing field provides the context for a game of football.  In an expedition concerned with coral reef ecology, then, it’s important to have a thorough understanding of geological processes, because they shape the history of the reef and can help predict its future.  Dr. Bastos, who hails from the Federal University of Espirito Santo, is a marine geologist with a special interest in the Abrolhos.  He is trying to understand what has happened in the prehistoric past and what is happening on the reef today by reading the shape of the bottom features (what geologists like to call morphology) and reconstructing a story and past and present events on the Abrolhos shelf.  Scientists call this sort of activity “inferring process from pattern”, and in terms of marine geology it brings with it some special challenges.  The biggest of these is that, for the most part, Alex can’t see the morphology he wants to study, certainly not as easily as a terrestrial geologist might fly above a mountain range and read the faults and synclines of the landscape to understand what geological forces shaped the land.  No, he has to construct his story a piece or two at a time, like putting together a jigsaw puzzle, often from indirect evidence.  He gets his jigsaw pieces from some pretty cool technology though, including seismic equipment, side scan sonar and by drilling cores out of the sediment.

Side scan sonar is an especially great tool that has become really popular in research circles in recent years.  It uses sound to reconstruct bottom morphology by sending out high frequency noises and then gathering back the echoes off the bottom, much the same way bats find food.  What makes side scan different from regular sonar is that instead of aiming the sound straight down under the boat, it is directed away to each side.  Since the sound hits objects and bounces back at an angle, any structure of any height will cast a sort of sound “shadow” on the side facing away from the boat.  The resulting image is a plan view, but with shadows that reveal shapes and structures, rather like taking a photo from an aeroplane late in the day, when shadows are long on the ground.

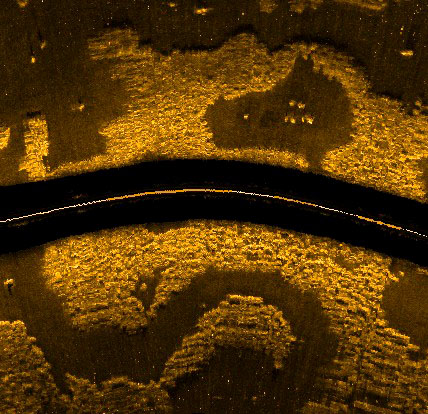
Side-scan reveals and ancient river channel. Img: Alex BastosBy combining studies of morphology with reconstructions of sea level at different times in geological history, Alex tells a story about the way the Abrolhos platform evolved.  Around 40 million years ago the main playing field was established by a flood of volcanic basalt that spread out to create the basis of the platform.  In the ensuing geological periods, carbonate rocks (i.e. limestone) were deposited, implying that reefs existed there at times in the distant past (my assertion in a previous post that there were no reefs on Abrolhos before 8,000 years ago was wrong).  During the last ice age, the sea level was over 100m lower than its current height, so much of the platform, including the locations of all the current shallow coral reefs, was above the surface.  At that time, a central depression in the platform was probably still filled with water, forming a shallow coastal lagoon opening to the south.  The Caravelas River probably drained into this lagoon from the north, cutting a number of different channels through the limestone as it meandered over time.  The river also provided a source of sediment that fanned out off the edge of the platform from the mouth of the lagoon.  All three of these features – the shallow depression, the channels in the limestone and the sediment fan – are still there on the bottom of the sea and help to tell the story.  At the end of the last ice age came the last great transgression, when sea level rose to approximately its current levels.  The entire platform was flooded, and corals once again colonized the platform and began to grow up towards the surface to where we see them today.

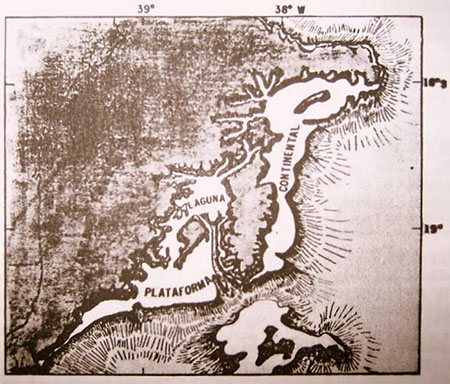
How Abrolhos might have looked during the last ice age; note the central lagoon opening to the south

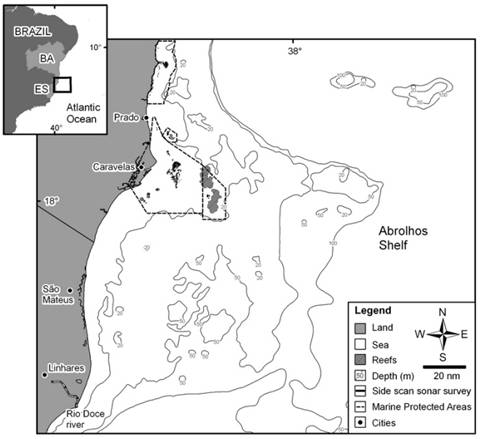
Current bottom topography of Abrolhos; note central depression due south of the islands

Holocene sedimentary processes.

Unfortunately, morphology only gets you so far.  Knowing the history of the platform, many of Dr. Bastos’ questions now relate to what has happened since the last transgression, during the most recent geological period (the Holocene), and most of these need other methods to answer.  These questions include “Is all the sediment on the platform a relict of geological history, or are sediments actively being deposited to this day?” and “If they are still being deposited, do they come from the land via the river, or are they produced in the ocean by corals, coralline algae and other organisms?”  To answer these questions, Alex will use a combination of seismic methods and sediment cores.  Seismic surveys provide indirect evidence of the nature of sediments below the surface of the sea bed, and these can be calibrated or “ground-truthed” by taking sediment cores that will reveal a timeline of sediment history on the platform.  These geological questions played a large part in the choice of sites for the main transects on this expedition.  One is to the south, in the mouth of that ice-aged lagoon, on the edge of the shallow-sloping fan of sediment.  The other is in the north, on a much steeper shelf break where the platform gives way to the deep sea beyond.  These two locations not only have profoundly different geology, but it’s likely that organic processes differ between them too, as we shall see in a future post.

Applying the lessons

Alex was telling me that one of the more satisfying aspects of his work is translating geology data into benthic (bottom) habitat maps.  In other words, taking all that information from the sonar morphology, the seismic data and the sediment cores, and mapping out what different parts of the platform are like on the bottom.  This is important, because once scientists can say with confidence that Area X is a rhodolith bed, or Area Y is a steep-sided valley, then they can predict with good accuracy what sorts of organisms will live there.  That sort of information is of critical value when deciding where to take biological samples and even more so when the Ministry of the Environment needs to make decisions about the boundaries of protected areas, which they are currently doing.  In this way geology plays a very important role in both the biological sciences and in conservation decision making.